SIR model
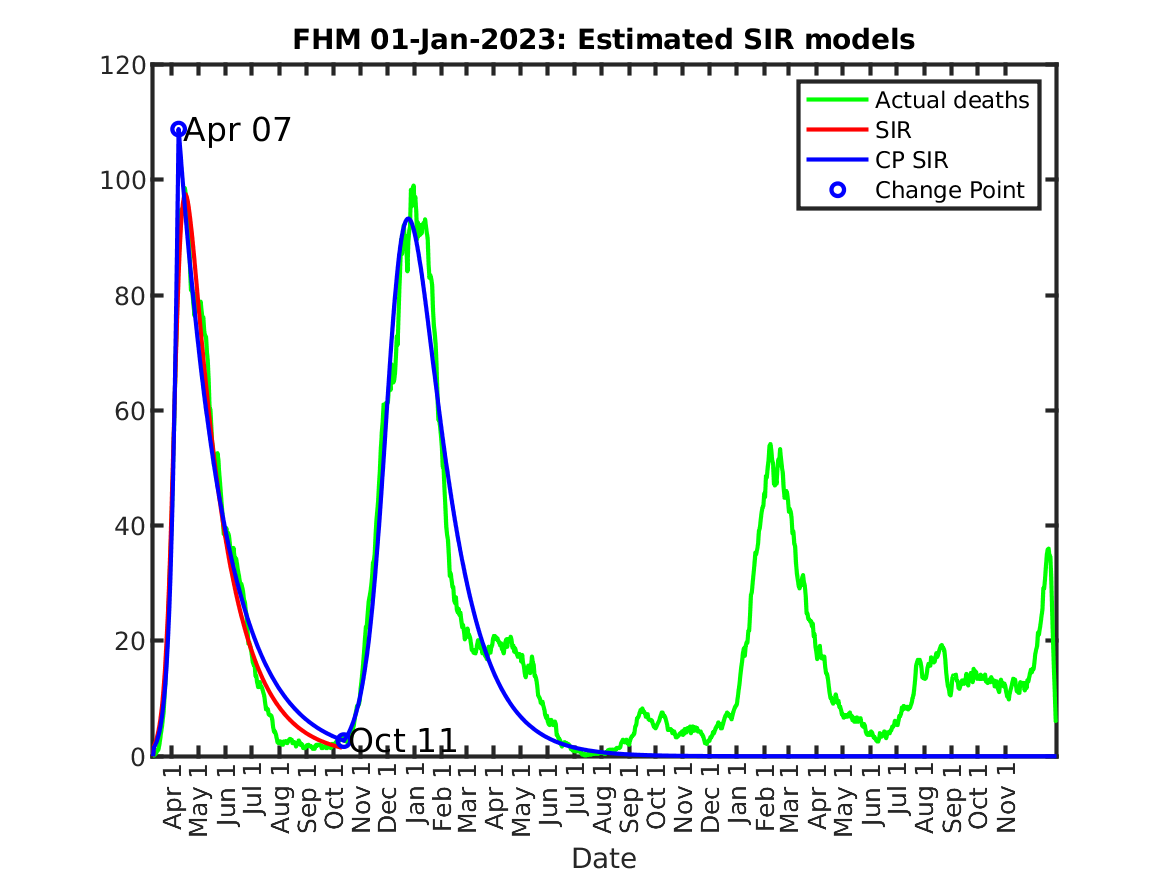
What we have shown in Ny Teknik is that the simplest possible model, the 100 years old susceptible-infectious-removed (SIR) model, can fit Swedish mortality data very well. The figure below shows actual data (running average over one week) together with the simplest possible SIR model (red line). The fit has a standard deviation (estimated by the square root of the loss function in the table below) of 6 deaths per day. By also including two change points at which the spread rate is allowed to change, an even better fit is obtained (standard deviation 2.5 deaths per day).
The possible gain of increasing model complexity beyond that of the SIR model needs to be weighed by the risk of overfitting, that may lead to increased sensitivity and decreased robustness.
There are in total 4 plus 2n parameters in the estimated model, including the change points where the dynamics in the time series change. The two cases of no change point and two change points are compared below.
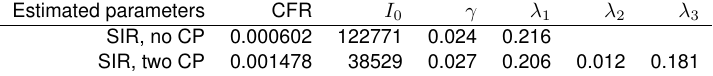
The estimated parameters can be coarsely interpreted in terms of the reproductive number R and the daily rate r. However, this assumes that we are in the initial phase where only a small number of of people have been infected.

Note that the purpose of this model is not to explain what has happened, but merely to show that rather simple models can be used to reproduce the observed mortality curve. This model is in stark contrast to the very complex models with hundreds of parameters that have been published in literature, that are only validated by comparing modeled and observed mortalities. Ockham would clearly have preferred the model above.