SCB
Statistics Sweden (SCB) publishes, among many other things, mortality statistics, retrieved from Table 1 in the excel sheet available here.
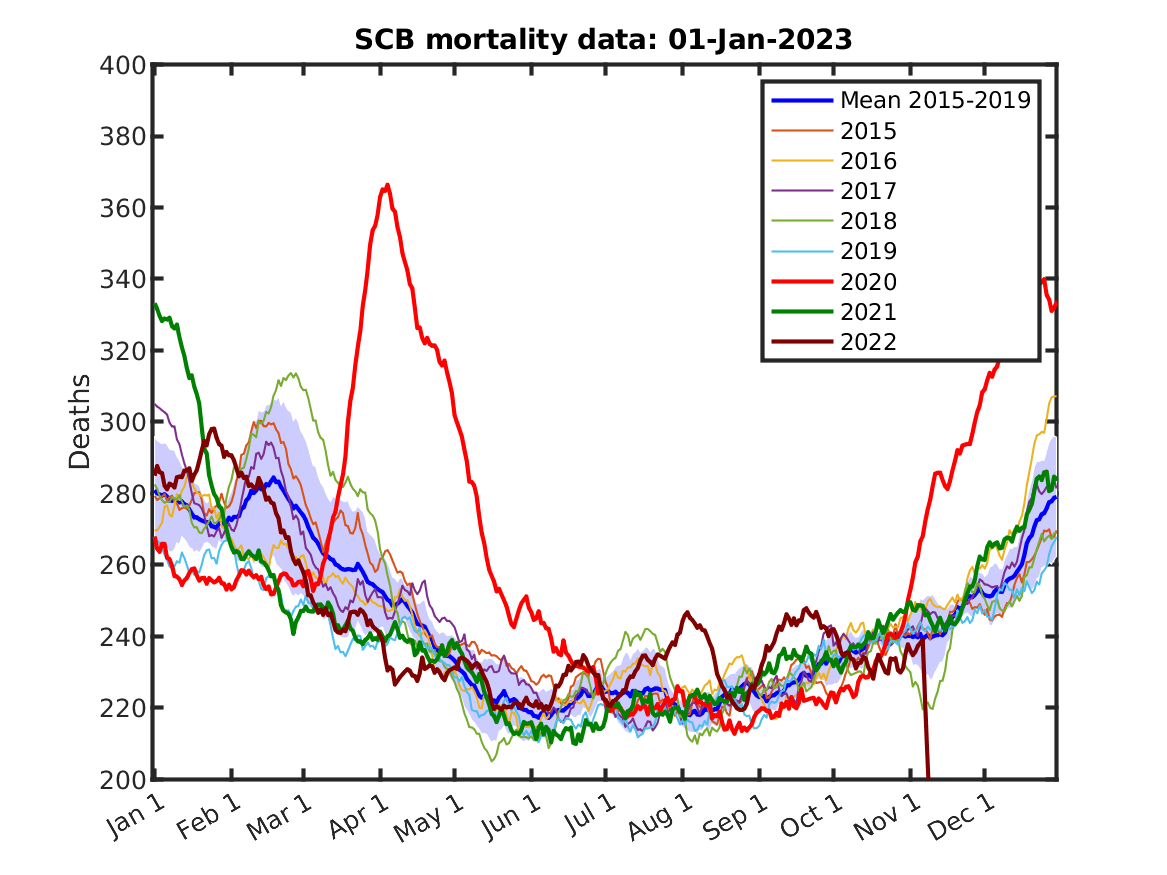
The figure below shows the total number of deaths week by week from 2015 to today. The years 2015-2019 are used to form a confidence bound. Excess mortality of 10-20% occurs regularly in the spring compared to the other months. In April 2020, excess mortality was about 50% and levelled out to normal during the summer and slightly below normal in the fall.
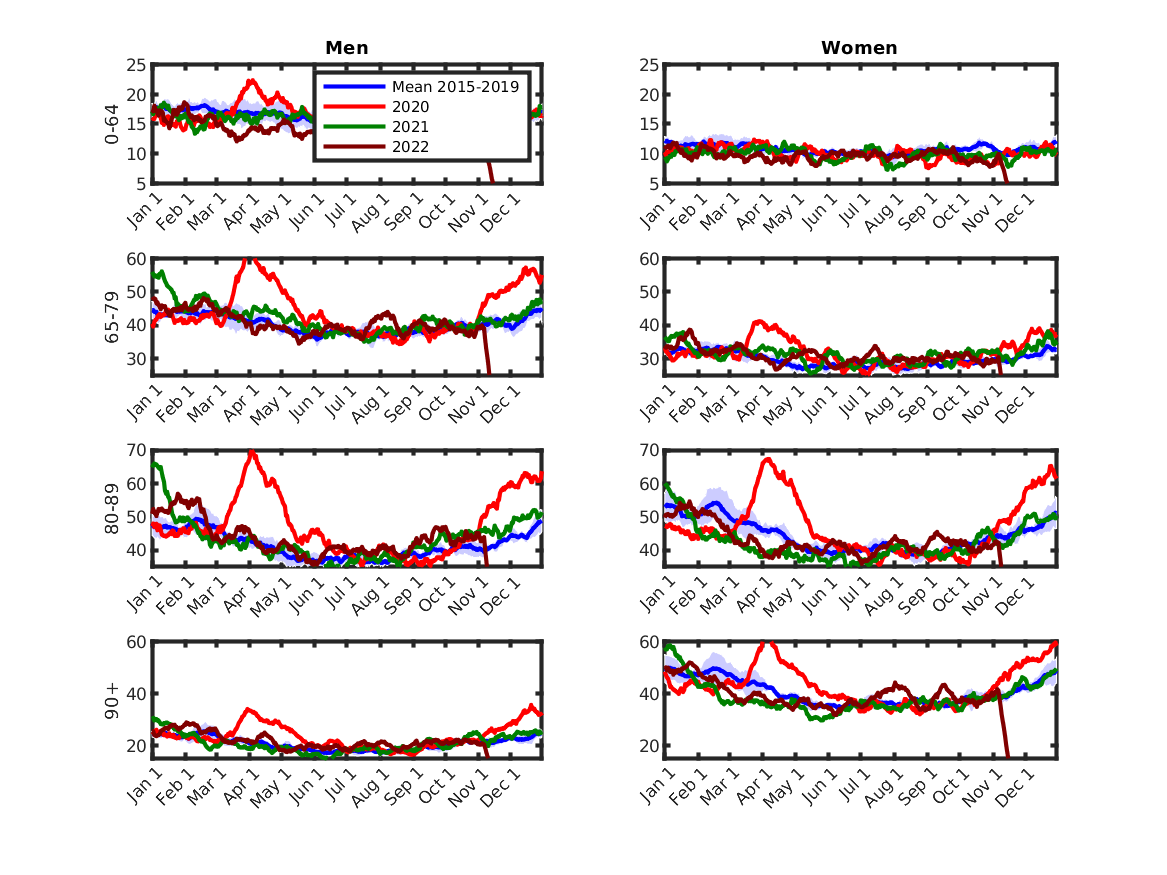
Mortality for different age groups 2019 and 2020 is compared in the next plot. Dotted lines correspond to 2019 and solid lines to 2020.
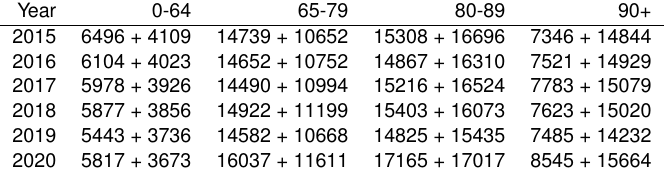
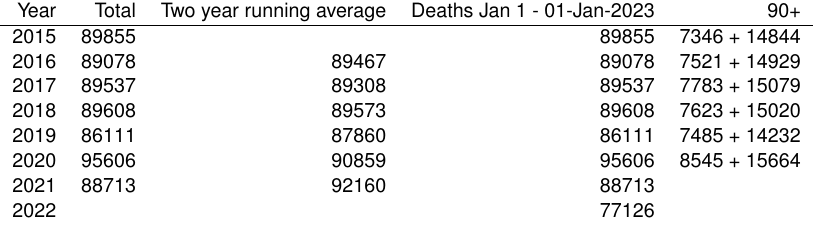
The following table shows the total number of fatalities year by year in these age groups (Men + Women).